The theme of this project is Happiness. Music is a source of happiness for many so to interpret the data topic,
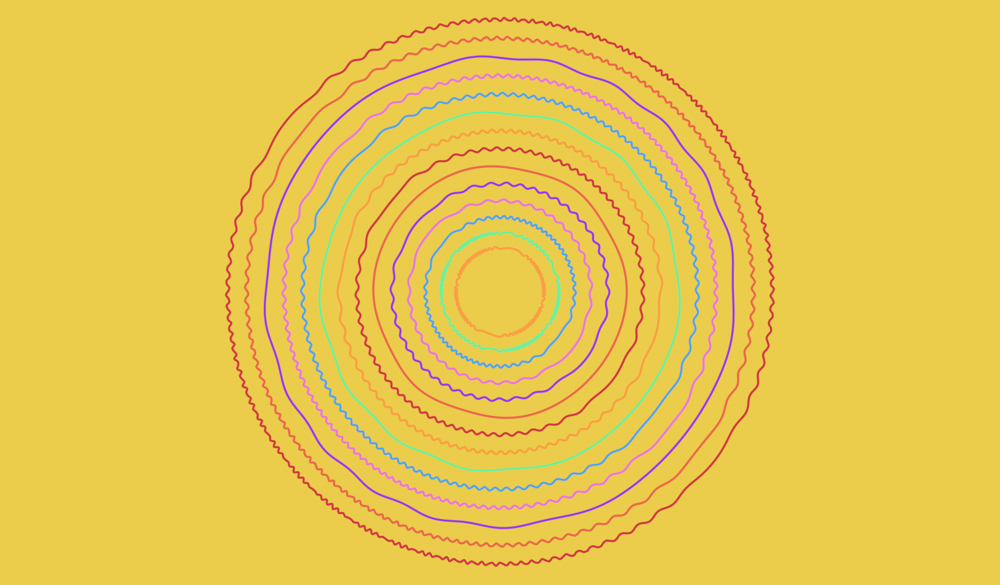
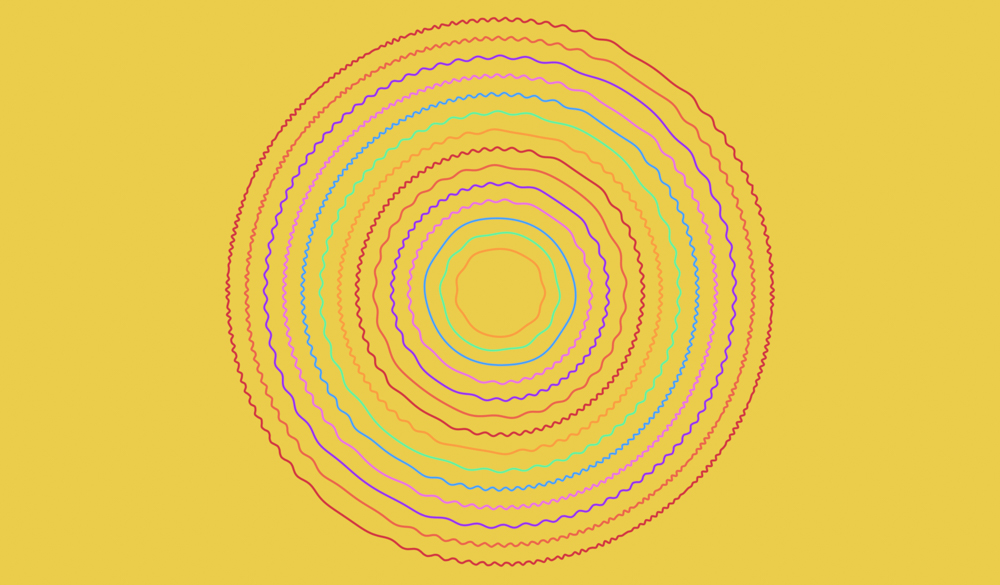
I've created a sound interactive audio visualization tool where users would see a graphic, when playing music,
on screen to capture the feeling of happiness through song. Using data from the "World Happiness Report 2020"
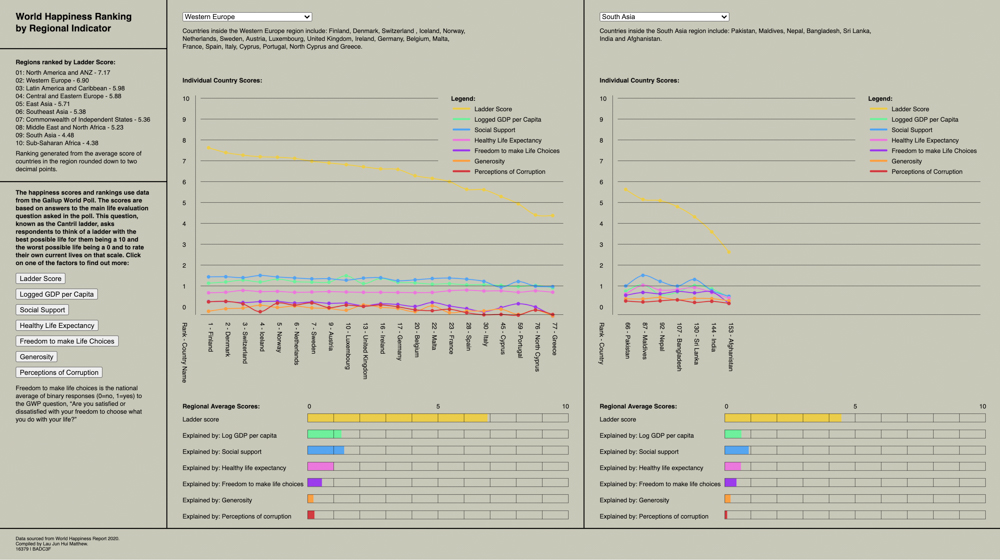
for the second sketch, I've chosen to create an app interface platform where users can access an overview of the data.
Please click here to access the app interface to view an overview of the data.
Reflection
I was most drawn to the topic of happiness as I thought it would be an interesting study to see how people would define happiness. Happiness is such a subjective term, it could mean a feeling or a mood and it could be perceived differently from people to people. And so I thought it would be interesting to study how experts defined different factors in their ranking of happiness. I also thought it would be good to look at things on a more macro level, looking at how different regions are ranked, and compiled another set of data from that based on the original source.
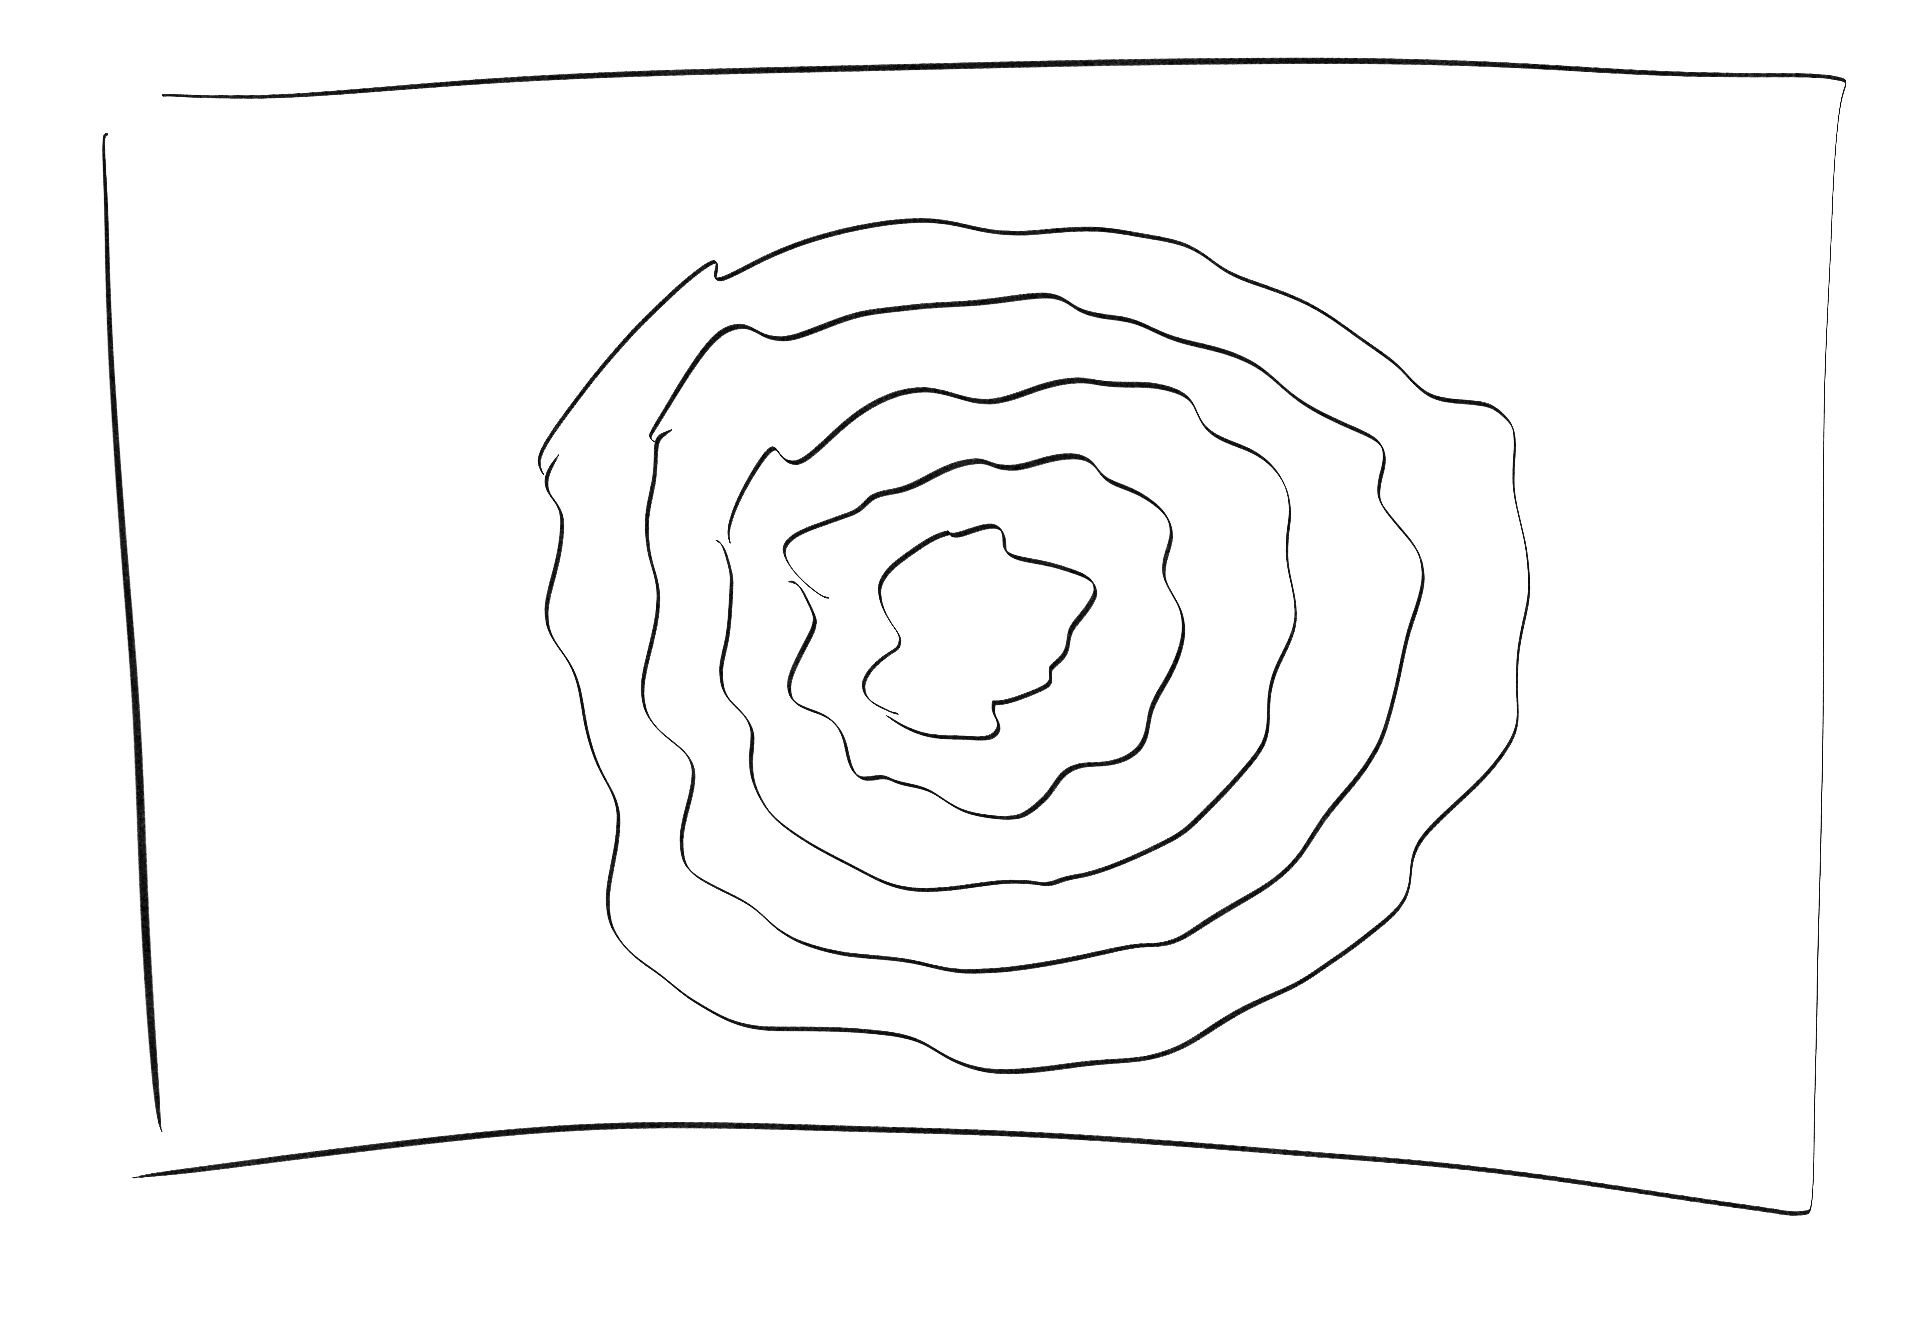
"I'm pickin' up good vibrations" as mentioned by The Beach Boys, based off my love of music and records. The audio visualizer graphics is based
of the visual interpretation of music using sine waves and also inspired by the grooves pressed into records that allow them to play music.
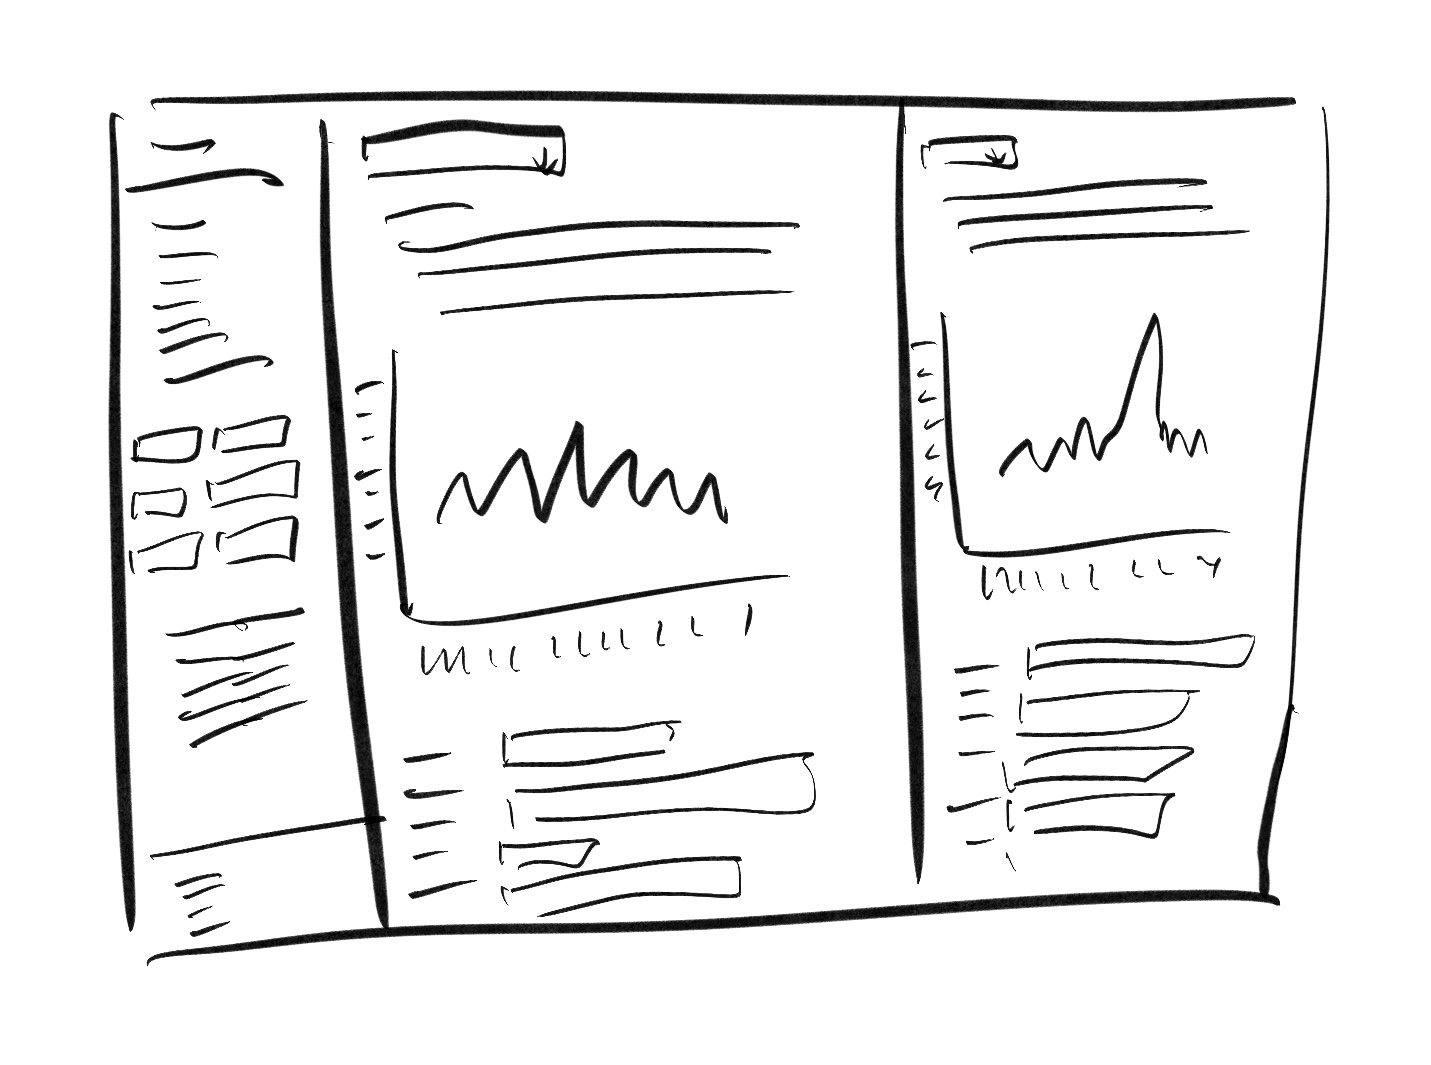
The data app interface was created as way to help users view the massive amount of data provided in the report all in one page and to allow them to
learn more about each aspect of criterias of happiness and compare data between different regions and countries.
Data Visualizer Sketch.
Data App Interface Sketch.
Issues
Most of the issues I faced were technical issues trying to figure out how to use
p5js. I found myself being too ambitious and trying to execute things way over my
current skill level. But the main issue faced in the data sketch was getting the
scale and positioning of the data to be accurate.
Feedback
"As the lines follow closely to the beat of the respective songs, it became somewhat like a responsive music video. I can’t
help but catch myself staring at the music spiral for a good 2mins, as it’s kinda therapeutic. It also resembles the motion of guitar strings.
I do feel to a certain extent, happy!
As for the graph is truly a work of art. I don’t even recall seeing such a detailed graph on news sites
(or maybe I just haven’t been reading news hahaha). I like how there are different types of graph is being used in this sketch to use to compare with each other,
this helps it not get too repetitive in terms of its visual. The only issue that I have would be the similar tone between the
background and the yellow graph line under ‘individual country scores’, it feels like its blending in with the background." - Siak
Achievements
I'm just really glad that I managed to pull off this project as a whole. All the
struggles faced were great for my learning process and I feel like I've really grown
and learnt p5js as new skill. I am not the same designer I was 14 weeks ago before p5js
entered my life. And I feel like I am better for it. I've really grown quite fond of
computation in design and this has given me the base to push it further.
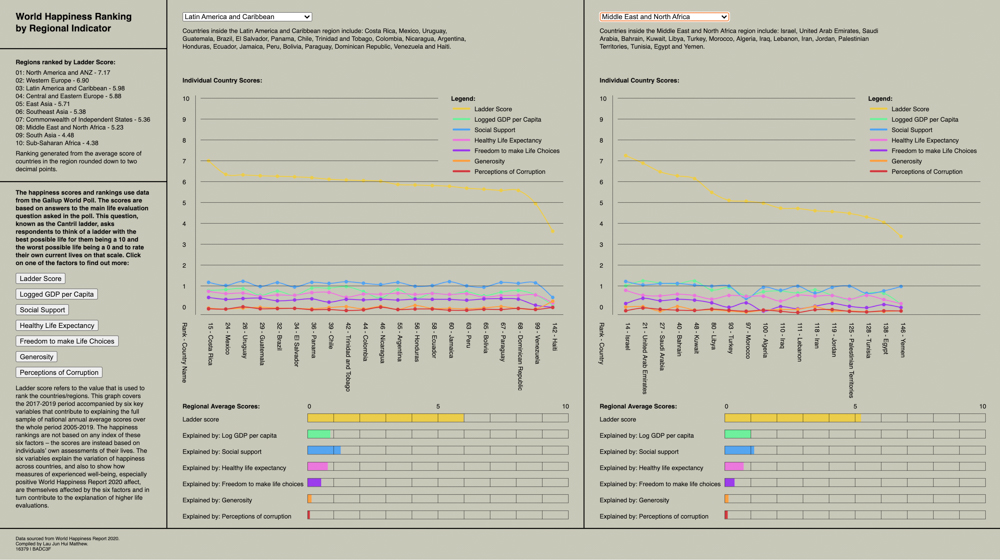
Comparing data between Latin America and Carribean region against Middle East and North Africa region.
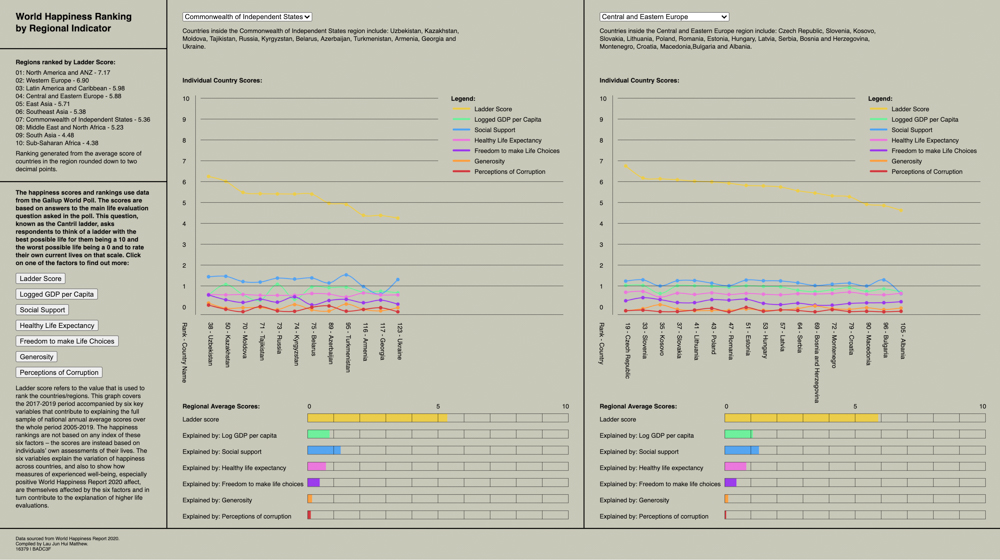
Comparing data between the Commonwealth of Independent States against the Central and Eastern Europe region.
Comparing data between Western Europe region against South Asia region using the data app interface.
Sound visualizer reacting to the bass, mid and treble of a song giving out some good vibrations.
Sound visualizer reacting to the bass, mid and treble of a song giving out some good vibrations.